Share this guidehttps://trailboard.run/aide-nutrition-en
Trail nutrition guide
Understand your nutrition profile
Trailboard does not lock you into a permanent category. A profile selects a coherent starting point, then training trials and race feedback refine the next strategy.
Scientific revision 1.2 · 1 August 2026
Reference profile
Trailboard’s average profile
This is not the biological average of every trail runner. It is a neutral simulation used to explain the engine: an 8-hour trail at moderate intensity, in mild weather, with average gut tolerance and 60 g/h already tested.
Medium confidence
Carbohydrates
Simulation: 60 g/h
480 g over 8 hours · reference range 50–70 g/h, not a universal value
Hydration
Simulation: 500 ml/h
4 L over 8 hours · thirst and conditions regulate actual intake
Sodium
Start: 300–600 mg/h
Link to sweat rate, sweat sodium concentration and selected products
Caffeine
Optional
Always totalled in mg and mg/kg, then tested before race day
Simulation assumptions
70 kg athlete — body mass is mainly used to interpret caffeine.
Beyond 2.5 hours, guidance extends up to 90 g/h according to need, tolerance and practicality. A 60 g/h target therefore sits at the lower end of a long-event strategy.
The ultra-specific position stand suggests 30–50 g/h and 450–750 ml/h for racing. A real ultra may therefore require a lower approach than general endurance guidance.
No absolute fluid volume suits everyone. The range prepares logistics; thirst, conditions, body-mass change and personal trials regulate actual intake.
The gastrointestinal system is adaptable. A value tested in training is more informative than a self-declared category alone.
Compare
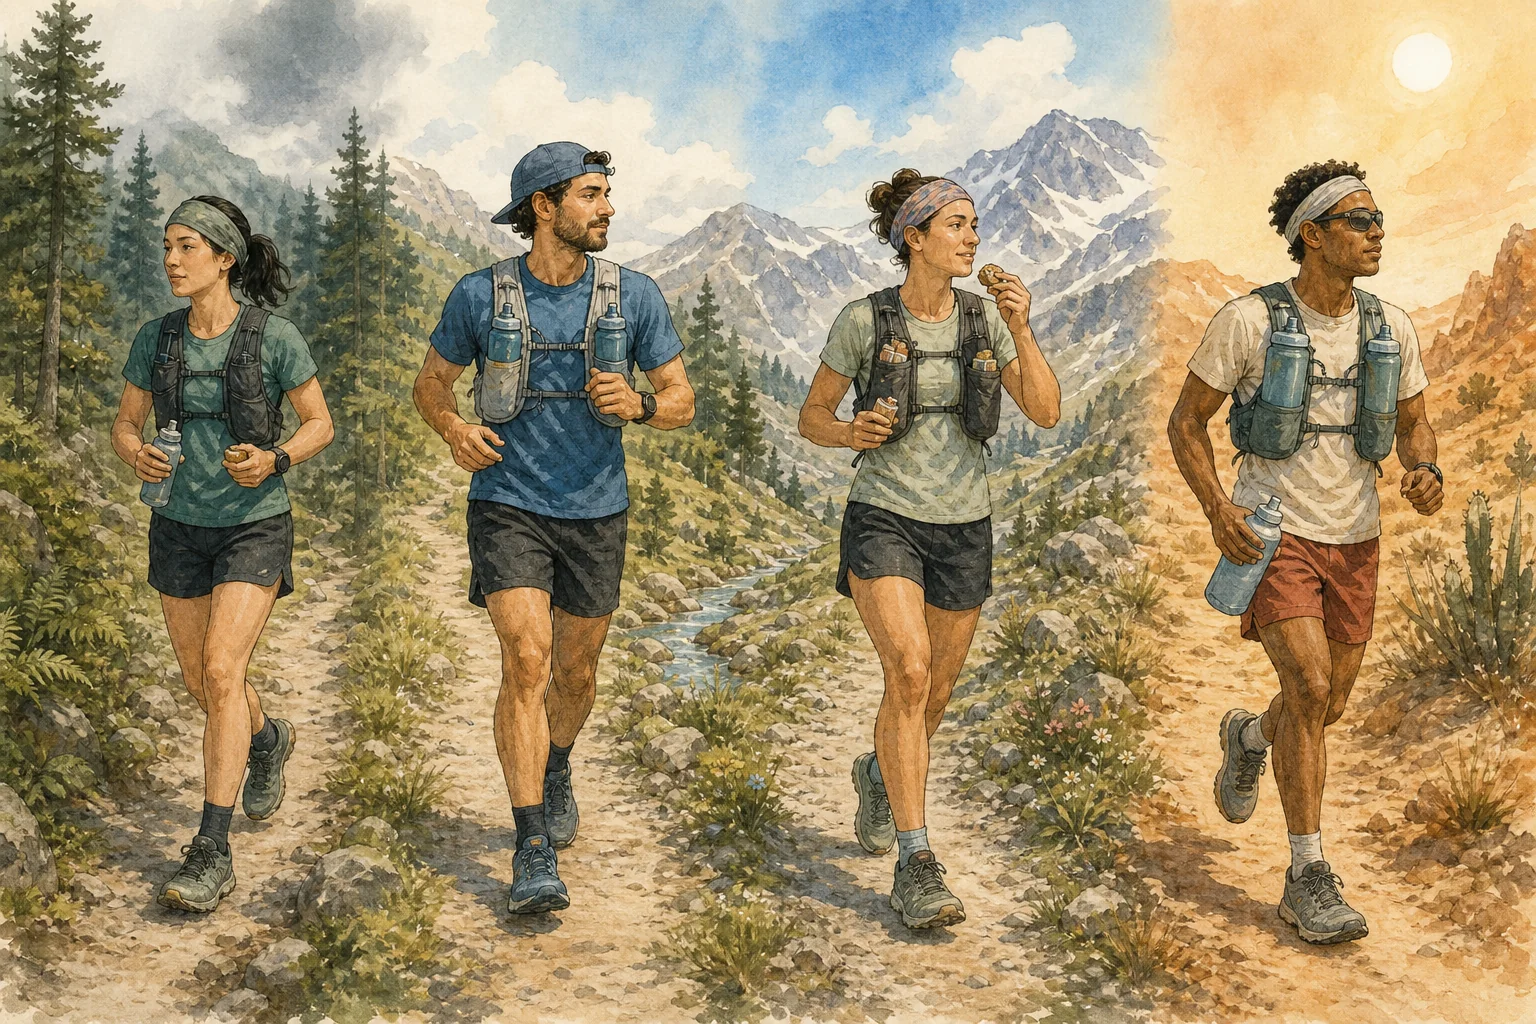
Four profiles, four starting points
Duration remains fixed at 8 hours so that only the profile changes. These figures are coherent Trailboard engine outputs, not performance goals.
A profile is not a level to reach: it is a starting context. Conditions, tolerance and what has already been tested shape the strategy.
Trailboard reference
Average profile
Simulation60 g/h
The central setting for a runner who has already validated 60 g/h without precise physiological measurements.
Assumptions used
Average tolerance
60 g/h tested
Mild weather
Average sweating
Carbohydrates
60 g/h
range 50–70
Hydration
500 ml/h
range 400–600
Sodium
300–600 mg/h
How to read this result
This is a stable starting point, not a universal target. Selected products and aid stations then determine the actual quantities to carry.
Understand the controls
What actually changes the plan
Each setting answers a different question. No single control summarises athletic ability.
FactorWhen low or unknownWhen high or confirmed
Intensity
When low or unknownMore room to eat, with needs still driven by duration.
When high or confirmedLess digestive margin; simpler and more frequent intakes.
Gut tolerance
When low or unknownConservative start and progressive gut training.
When high or confirmedThe upper range is possible once it has been repeated.
Carbohydrate experience
When low or unknownTrailboard limits ambition and lowers confidence.
When high or confirmedThe tested value bounds the target without automatically exceeding it.
Heat
When low or unknownStandard fluid range, still adjusted to thirst.
When high or confirmedLogistical need rises; intake should not be forced beyond tolerance and thirst.
Sweat / salt
When low or unknownA cautious assumption when measurement is missing.
When high or confirmedSweat rate and sodium concentration must be separated and confirmed individually.
Drink and variety
When low or unknownCarbohydrates mainly come from carried foods.
When high or confirmedA carbohydrate drink counts only when a real product is selected.
Trailboard algorithms
What Trailboard calculates, and what it cannot know
These outputs come from deterministic backend functions. They help organise a plan; they do not replace field trials or the athlete’s decision.
01
1. Carbohydrate target and total
manual target: total = g/h × duration (min) / 60
A 60 g/h entry for 8 h: 60 × 480 / 60 = 480 g to cover.
An entered target is kept unchanged. Without an entry, the engine combines a duration baseline, intensity, tolerance and heat multipliers, then the experience cap. It finally bounds that output inside the reference range calculated by the backend.
Measured sweat rate of 1 L/h: 1 × 1,000 × 60–80% = 600–800 ml/h. For a 1 h 45 segment, the upper bound requires 800 × 1.75 = 1,400 ml.
Without a measurement, Trailboard uses a context range, for example 500–800 ml/h in hot weather, then applies ±100 ml/h for reported low or high sweating. It also compares required fluid with carrying capacity and flags an impossible segment.
03
3. Sodium and drink concentration
estimated loss = sweat rate (L/h) × sweat sodium (mg/L); target = 35–65% of that loss
1 L/h and 900 mg/L: loss = 900 mg/h; target = 315–585 mg/h. At 600 ml/h, midpoint concentration = 450 ÷ 0.6 = 750 mg/L.
When both measurements are missing, Trailboard keeps a cautious heat-based range: 300–600 mg/h in a standard context, 500–900 mg/h in heat or with a reported salty profile. “Salty” never increases drink volume: it only describes a sodium-concentration assumption.
04
4. Products, portions and missing information
actual portion = product carbohydrates × quantity; quantity rounded to 1/2 serving
100 min, 60 g/h, 20-min cadence, a 25 g gel then a 40 g bar: 1 gel (25), 1/2 bar (20), 1/2 gel (12.5), 1/2 bar (20), 1 gel (25) = 102.5 g stored.
The timeline cycles products containing carbohydrates and only keeps a half serving when its difference from the marker is at or below 7.5 g. Without a product, it keeps free intakes in grams. An “isotonic” strategy without a listed drink stays a separate assumption: at 500 ml/h for 3 h, 60 g/L represents an assumed 90 g, never automatically removed from or added to planned intakes. Generated portions remain proposals to confirm and save.
Safety and interpretation
Reference points that are not interchangeable
These distinctions stop a planning value from becoming a prescription or a false physiological measurement.
01
Hydration and body mass
The ml/h target prepares carried volume between water points; it does not require mechanical drinking. Avoid gaining body mass during exercise. A moderate loss can be normal, but should not become a target.
Need depends on both sweat volume and sweat sodium concentration. Tablets, drinks and foods must be totalled without promising to prevent cramps or hyponatraemia.
Caffeine remains optional. The 3–6 mg/kg range is a commonly studied effective range, not a universal maximum: a lower dose may work and more is not necessarily better. Total all sources, test timing, and seek professional advice with marked anxiety, hypertension, pregnancy or relevant medication.
Multiple transportable carbohydrates, such as glucose and fructose, become more important. Ingestion, intestinal absorption and digestive tolerance are different concepts: lack of symptoms does not directly measure absorption.
A drink providing 30 g in 500 ml contains 6% carbohydrate. Concentration, osmolality and gastric emptying influence comfort but cannot predict individual tolerance on their own.
For each segment between confirmed aid stations, turn the hourly rate into portions that can actually be carried and consumed. A missed intake lowers actual intake: resume with a tested portion when practical, without concentrating the shortfall into one large intake.
Weather, sweat or experience data is missing. Trailboard uses a broad, non-blocking range.
Medium
Duration and main settings are known, but no physiological measure confirms the strategy.
High
Intake has been tested during comparable efforts and sweat or product data is known.
Isotonic drinks: avoid double counting
Choosing “isotonic” describes a strategy. Carbohydrates become actual intake only when a drink with known composition and volume is selected. Trailboard can then calculate carbohydrate concentration and separate assumed composition from what is actually planned in the bag.
Before medical validation
These references are informational. Kidney, cardiac or metabolic conditions, hypertension, previous hyponatraemia, repeated gastrointestinal problems, pregnancy, significant anxiety or medication interacting with caffeine or hydration require advice from a physician or sports dietitian.
References
Where do the ranges come from?
Trailboard uses recognised consensus statements for its boundaries, then applies cautious trail-specific adaptations. Field experience never replaces scientific references when setting a number.
Member space
Comments
Share your experience, ask a question or add a useful insight for the community.