
The displayed times and paces use the running model and are not cycling estimates.
- Position on the route
- 0 km
- Distance
- 38.8km
- Estimated time
- 5h51
- Elevation gain
- 792m
- Elevation loss
- 784m
| Arrival time | Route progress | Waypoint | Elevation profile | Km | D+ / D−m | Pacingmin/km | Services | |
|---|---|---|---|---|---|---|---|---|
| — | 0 km | — | — | |||||
| — | 05:51D+ 792 mD− 784 m | 38.83 km | 792784 | — |
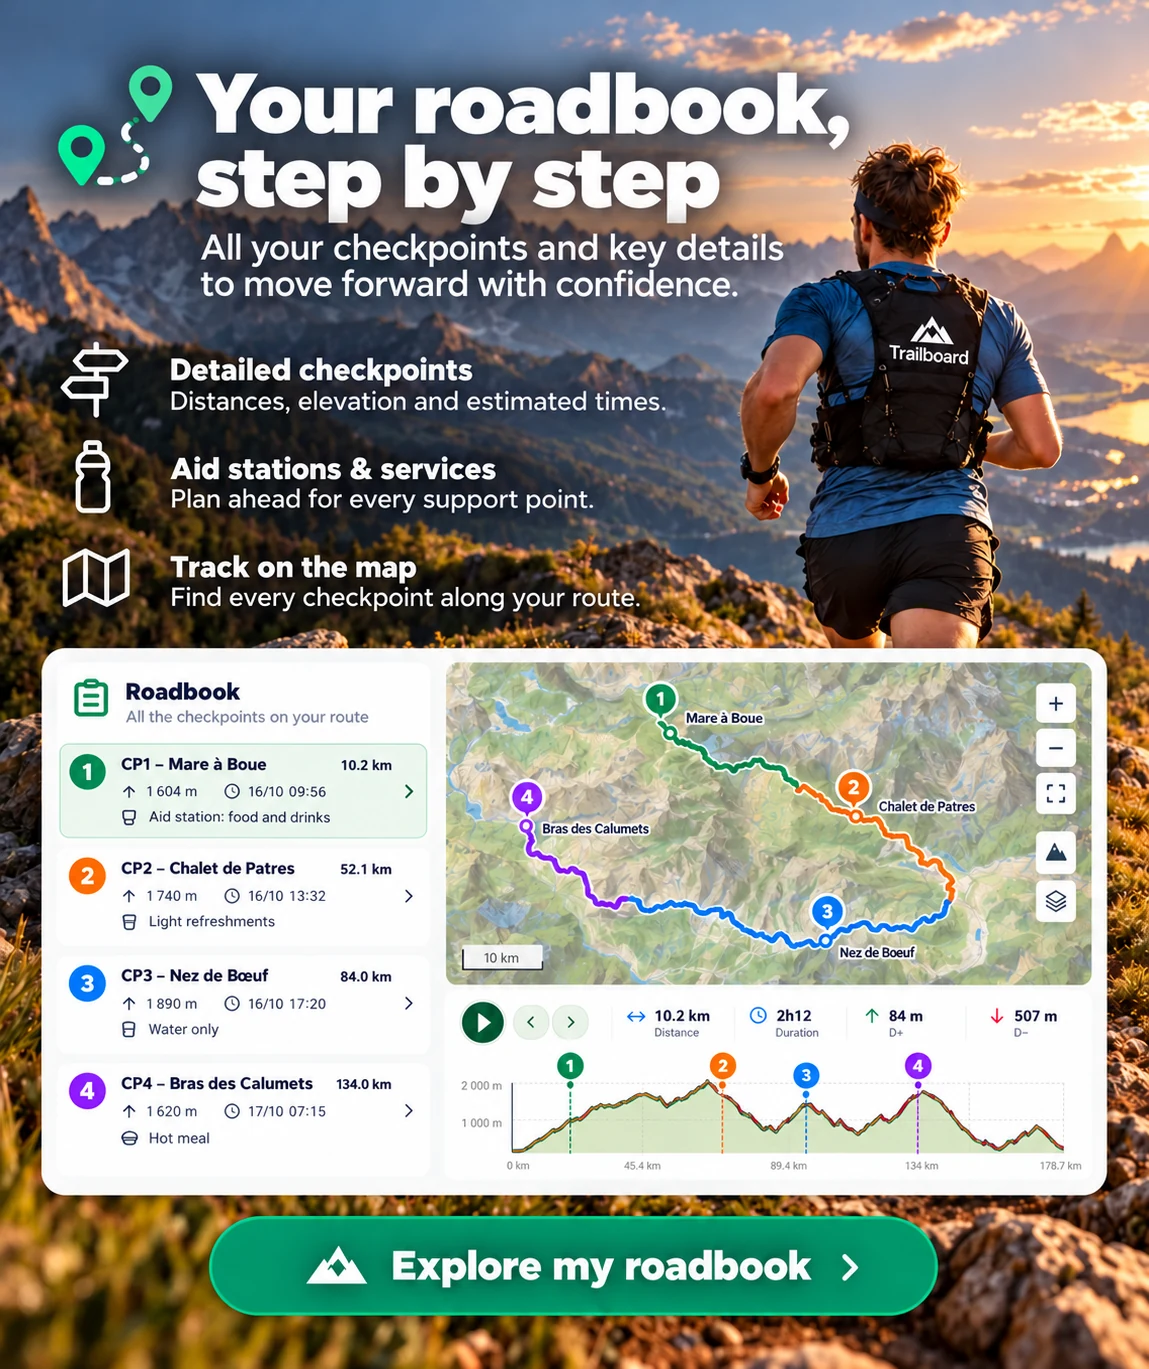
Sections identified on the preview; cumulative ascent, descent and maximum elevation come from the complete track.
Course analysis
Sections identified on the preview; cumulative ascent, descent and maximum elevation come from the complete track.